
- When a chemical reaction occurs, certain amount of heat is given off or absorb.
- The energy change in the chemical reaction can be presented by an energy level diagram.
- An energy level diagram it is a graph that shows the energy change in a chemical reaction.
Exothermic Reaction
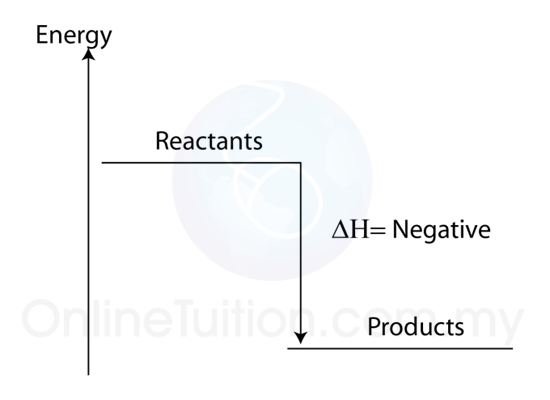
- Figure below shows the general energy level diagram for exothermic reaction.
- We can see that the energy decreases after reaction. This is because energy is given off during an exothermic reaction.
Example
Zn + 2HCl → ZnCl2 + H2
∆H = 126 kJ mol-1
The energy level diagram of the reaction above is as below:

Endothermic reaction
- Figure below shows the general energy level diagram for endothermic reaction.
- The energy increases after reaction. This is because energy is absorbed during an endothermic reaction.

Example
CuO + H2 → Cu + H2O
∆H= +130.5 kJ mol-1
The energy level diagram of the reaction above is as below:

Hi there! Thank you so much for all.your info… it was very helpful and your video explanation was great too! Thanks a lot once again!
Hi sir! Thank you so much for the info… I really do appreciate your help… just a little request… please continue making more websites like these… they are really proving a great help to those who can’t afford any tuition classes and ever since I started using this website a year ago, my grades have improved tremendously and I’m always ahead in class… thanks again for all your help in spreading this act of kindness and have a blessed day!??