
Example
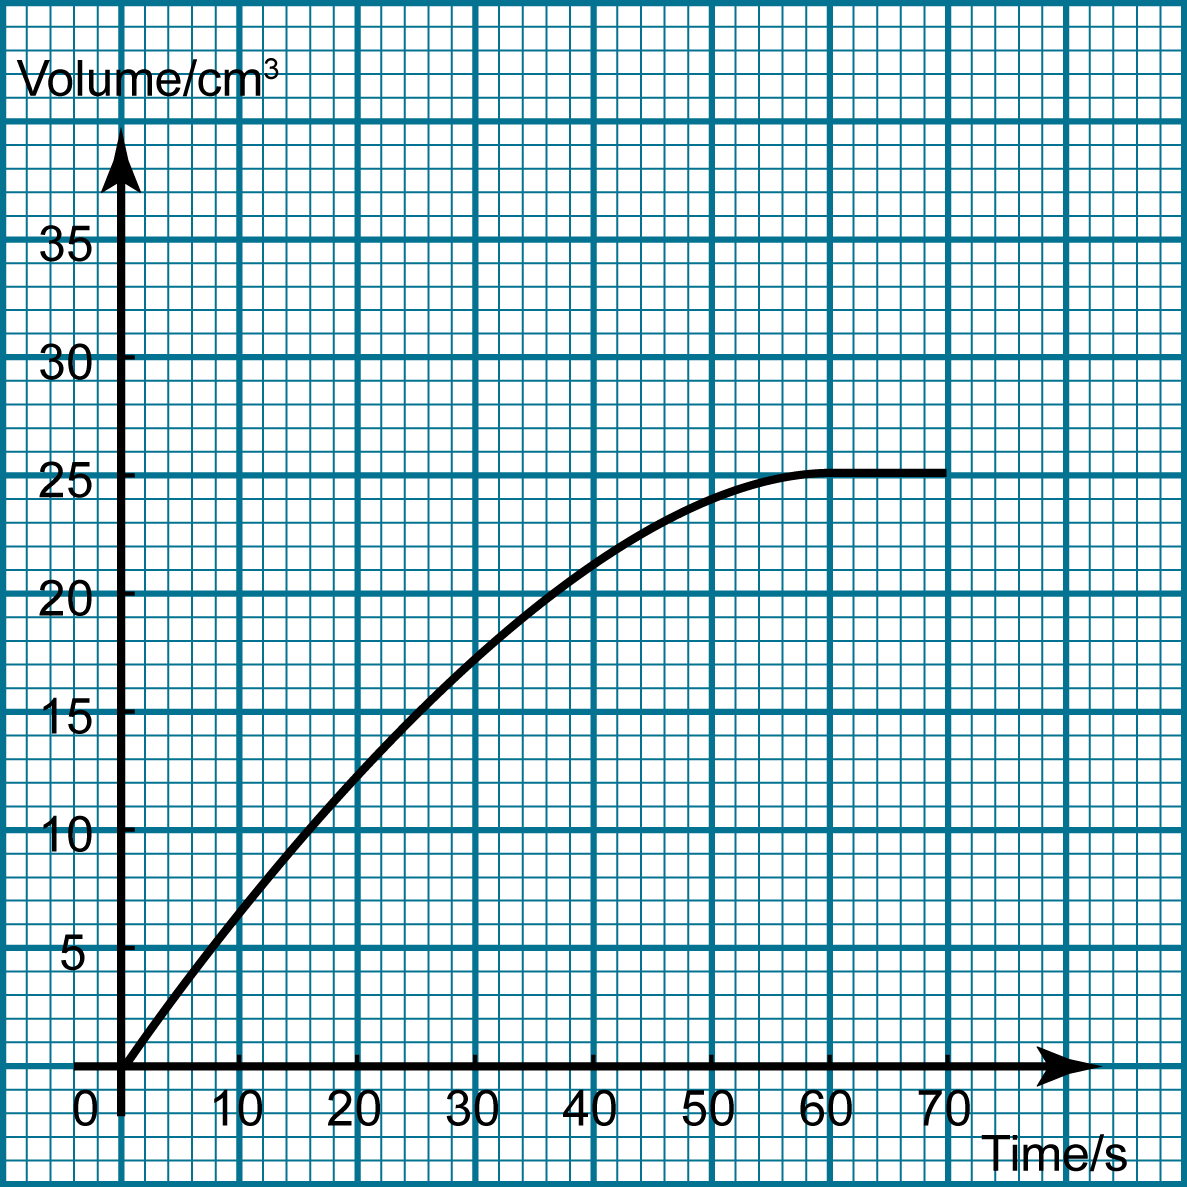
In a reaction between calcium carbonate and liquid hydrochloric acid, carbon dioxide gas that is released is collected in a burette. The graph shows the volume of carbon dioxide collected over time. Find the average rate of reaction in the first 60s.
Answer:
